Prop Firm Hacks
Table of Content
Understanding Essential Financial Performance Metrics in Prop Trading
Financial performance metrics provide critical insights into a prop firm’s health and potential for trader success, moving beyond simple profit splits to reveal underlying stability, operational efficiency, and commitment to risk management. Key indicators include return on equity (ROE), revenue, gross profit margin, and Sharpe Ratio.

Understanding a prop firm’s financial health begins with a thorough analysis of key profitability indicators.
For the modern trader, viewing a prop firm not just as a funding source but as a financial partner requires a rigorous analysis of these figures. It is no longer enough to look at a shiny dashboard; you must understand the engine under the hood.
The proprietary trading industry has undergone a massive shift from 2024 to 2026. Data transparency has become the new gold standard. Traders are increasingly looking for firms that don’t just promise capital but can prove they have the liquidity and operational resilience to pay out during high-volatility events.
By analyzing prop firm financial performance metrics, a quant or retail trader can distinguish between “hollow” firms that rely solely on new evaluation fees to pay existing traders (a Ponzi-lite model) and “performance-first” firms that generate revenue through real market participation and successful trader profit splits.
Market data from 2024–2026 shows that only around 5%–12% of traders pass evaluations, while the percentage that actually reaches a payout is even lower, at just 2%–6%. This raises a critical question: where does a prop firm’s revenue really come from?
Defining Key Profitability Indicators: Revenue, Net Profit, Gross Profit Margin
Profitability is the most obvious sign of a healthy firm, but it’s often misunderstood. Revenue in a prop firm typically comes from two sources: evaluation fees and the firm’s share of profits from funded accounts.
Market data shows that in many retail-focused prop firms, 60%–90% of total revenue is derived from evaluation fees, while only 10%–40% comes from actual trading performance.
A high-quality firm aims for the latter to be a significant portion of their income. Gross Profit Margin helps traders understand how much “buffer” a firm has after paying its direct costs—primarily payout distributions and brokerage fees. If the margin is too thin, the firm might struggle to scale or invest in better technology for its users.
Assessing Capital Efficiency: Return on Assets (ROA) and Return on Equity (ROE)
Capital efficiency measures how well a firm uses its available resources to generate profit. Return on Equity (ROE) is particularly telling for prop firms because it reveals if the firm is efficiently leveraging its internal capital and the capital provided by its backing partners.

Visualizing growth trends can illustrate how efficiently a firm uses its capital to generate profits.
| Metric | Typical Market Range | Interpretation |
|---|---|---|
| Return on Equity (ROE) | ~15% – 25% (standard firms) | Healthy capital utilization |
| ~20% – 40%+ (top-tier firms) | Strong performance, efficient leverage | |
| <10% | Weak efficiency / fee-dependent model | |
| Return on Assets (ROA) | ~5% – 15% | Normal range with leverage applied |
| ROE – ROA Spread | ~10% – 25% | Indicates effective use of leverage |
| Payout Coverage Capacity | ~2% – 6% of traders paid | Low payout frequency → liquidity pressure |
| Funded Account Lifespan | ~1 – 3 months | High churn impacts capital efficiency |
| Capital Utilization Rate | ~60% – 85% | % of capital actively deployed |
| Liquidity Buffer Ratio | ~10% – 30% reserves | Ability to handle withdrawal spikes |
| Simultaneous Payout Stress | 2x – 5x normal payout volume | Occurs during high volatility events |
High ROE suggests a firm is sophisticated in its risk management and strategy allocation, meaning they are likely to remain stable even when large payouts are requested simultaneously. This metric is a backbone for those looking for the best prop trading firms 2026.
The Role of Operational Metrics: Cash Conversion Cycle and Operating Expenses
Operational metrics often fly under the radar, but they dictate the “speed of business.” The Cash Conversion Cycle—how fast a dollar spent on marketing or technology turns back into cash—is vital. Similarly, operating expenses (OpEx) tell you where the firm’s priorities lie.
AI Prop’s Financial Footprint: Data-Driven Success and Stability
AI Prop demonstrates robust financial performance through its innovative AI-powered coaching and blockchain-backed payout verification, contributing to a performance-first revenue model.

AI-powered coaching and blockchain verification underpin AI Prop’s transparent and data-driven approach to financial performance.
This structure prioritizes trader profitability, enhancing capital efficiency and fostering long-term growth for both the firm and its traders. By shifting the incentive away from evaluation failure and toward long-term fund management, AI Prop creates a unique financial footprint in the 2026 market.
Based in Dubai Digital Park, AI Prop operates under a model that merges FinTech efficiency with institutional-grade liquidity. Their $5M capital growth plan isn’t just a marketing hook; it’s backed by a sophisticated risk engine that treats funded traders as remote fund managers.
AI Prop Data Metrics Table (2026)
| Metric / Information | Data Detail | Strategic Significance |
| Capital Growth Plan | $5,000,000 ($5M) | Maximum scaling potential for successful traders. |
| Market Timeline | Year 2026 | Defines the firm’s footprint in the current market cycle. |
| Operational Base | Dubai Digital Park | Positioned in a global FinTech and digital innovation hub. |
| Verification Tech | Blockchain | Ensures 100% transparency for payout verification. |
| Operating Model | FinTech + Institutional Liquidity | Merges tech efficiency with high-tier financial backing. |
| Target Audience | High-net-worth quants | Attracts professional traders skeptical of traditional firms. |
Their integration with blockchain technology for payout verification ensures that every dollar earned is visible and verifiable, which serves as a massive trust signal for high-net-worth quants who are often skeptical of the “black box” nature of traditional prop firms.
Evaluating AI Prop’s Profitability: Performance-First Revenue Model and Capital Growth
Unlike firms that rely on a high “churn rate” of failing traders, AI Prop’s performance-first model relies on the 20% profit share they retain from successful traders.
To make this profitable, they must ensure their traders succeed. This is where the AI Coach and AI Journal come in—tools designed to fix behavioral leaks that usually lead to evaluation failure.
Financially, this results in a higher “Lifetime Value” (LTV) per trader for the firm, creating a more sustainable and less volatile revenue stream than fee-only competitors.
AI Prop’s Operational Efficiency: Streamlined Processes and Tech-Driven Cost Management
By automating much of the risk management and coaching through proprietary algorithms, AI Prop keeps its OpEx remarkably low compared to firms with large, manual support and compliance teams.
This technical efficiency is passed on to the trader in the form of flexible rules—such as allowing weekend holds and news trading—and highly competitive profit splits. This tech-heavy approach is a hallmark of prop firms with AI-powered risk management.
Scaling Capital: How AI Prop Supports Traders Up to $5M
One of the rarest sights in the prop industry is a firm that actually follows through on multi-million dollar scaling. AI Prop’s roadmap to $5M is structured around performance milestones.
Financially, this scaling is facilitated by their partnership with Coinstrat Pro, which provides the deep liquidity needed to support large lot sizes without massive slippage. This makes AI Prop a strong contender for the best prop firm for high capital scaling in 2026.
MyFundedFX’s Financial Outlook: Traditional Strengths and Market Position
MyFundedFX, a prominent player in the prop trading space, showcases its financial strength through established operational models and a defined market strategy.

MyFundedFX maintains a strong market position through its established operational models and clear market strategy.
While specific real-time financial metrics for MyFundedFX are not publicly available in competitor research, success stories and market reputation often highlight their consistent performance for traders. They represent the “established” tier of modern prop firms that have survived multiple market cycles.
MyFundedFX has built a reputation for reliability. Its financial outlook is rooted in high-volume trader participation and a diverse set of challenge types.
While AI Prop leans into “Deep Tech,” MyFundedFX focuses on user experience and a broad range of tradable assets, appealing to the general retail market. Their strength lies in their brand equity and the massive community trust they have built through consistent payouts over the years.
Analyzing MyFundedFX’s Revenue Streams and Profitability Structure
MyFundedFX likely operates on a traditional prop firm revenue model: a mix of evaluation fees and a percentage of profitable trades. Their profitability is driven by volume.
By offering a variety of challenges (1-step, 2-step), they capture a wide net of traders from beginners to intermediates. This diversity helps stabilize their revenue, as different market conditions favor different types of traders within their ecosystem.
Operational Efficiency in Practice: Insights into MyFundedFX’s Business Model
The operational efficiency of MyFundedFX is seen in their payout systems and dashboard integrations. While they may not use blockchain for verification, their long history of “proof of payouts” on social platforms serves as their transparency metric.
They have optimized their “middle office”—the team that handles compliance and payouts—to be as fast as possible, which is a key driver for trader retention in the competitive 2026 landscape.
Market Standing and Growth Trajectory of MyFundedFX
MyFundedFX remains a dominant force because they provide what traders want: a clear path to funding without excessive gimmicks.
Their growth trajectory is steady, focusing on expanding into new markets and offering more flexible trading conditions to keep up with the innovations introduced by firms like AI Prop. They represent the “Gold Standard” of the previous generation that is successfully adapting to the new era of financial freedom.
Risk Management and Trader Success: Sharpe Ratio and Drawdown Analysis
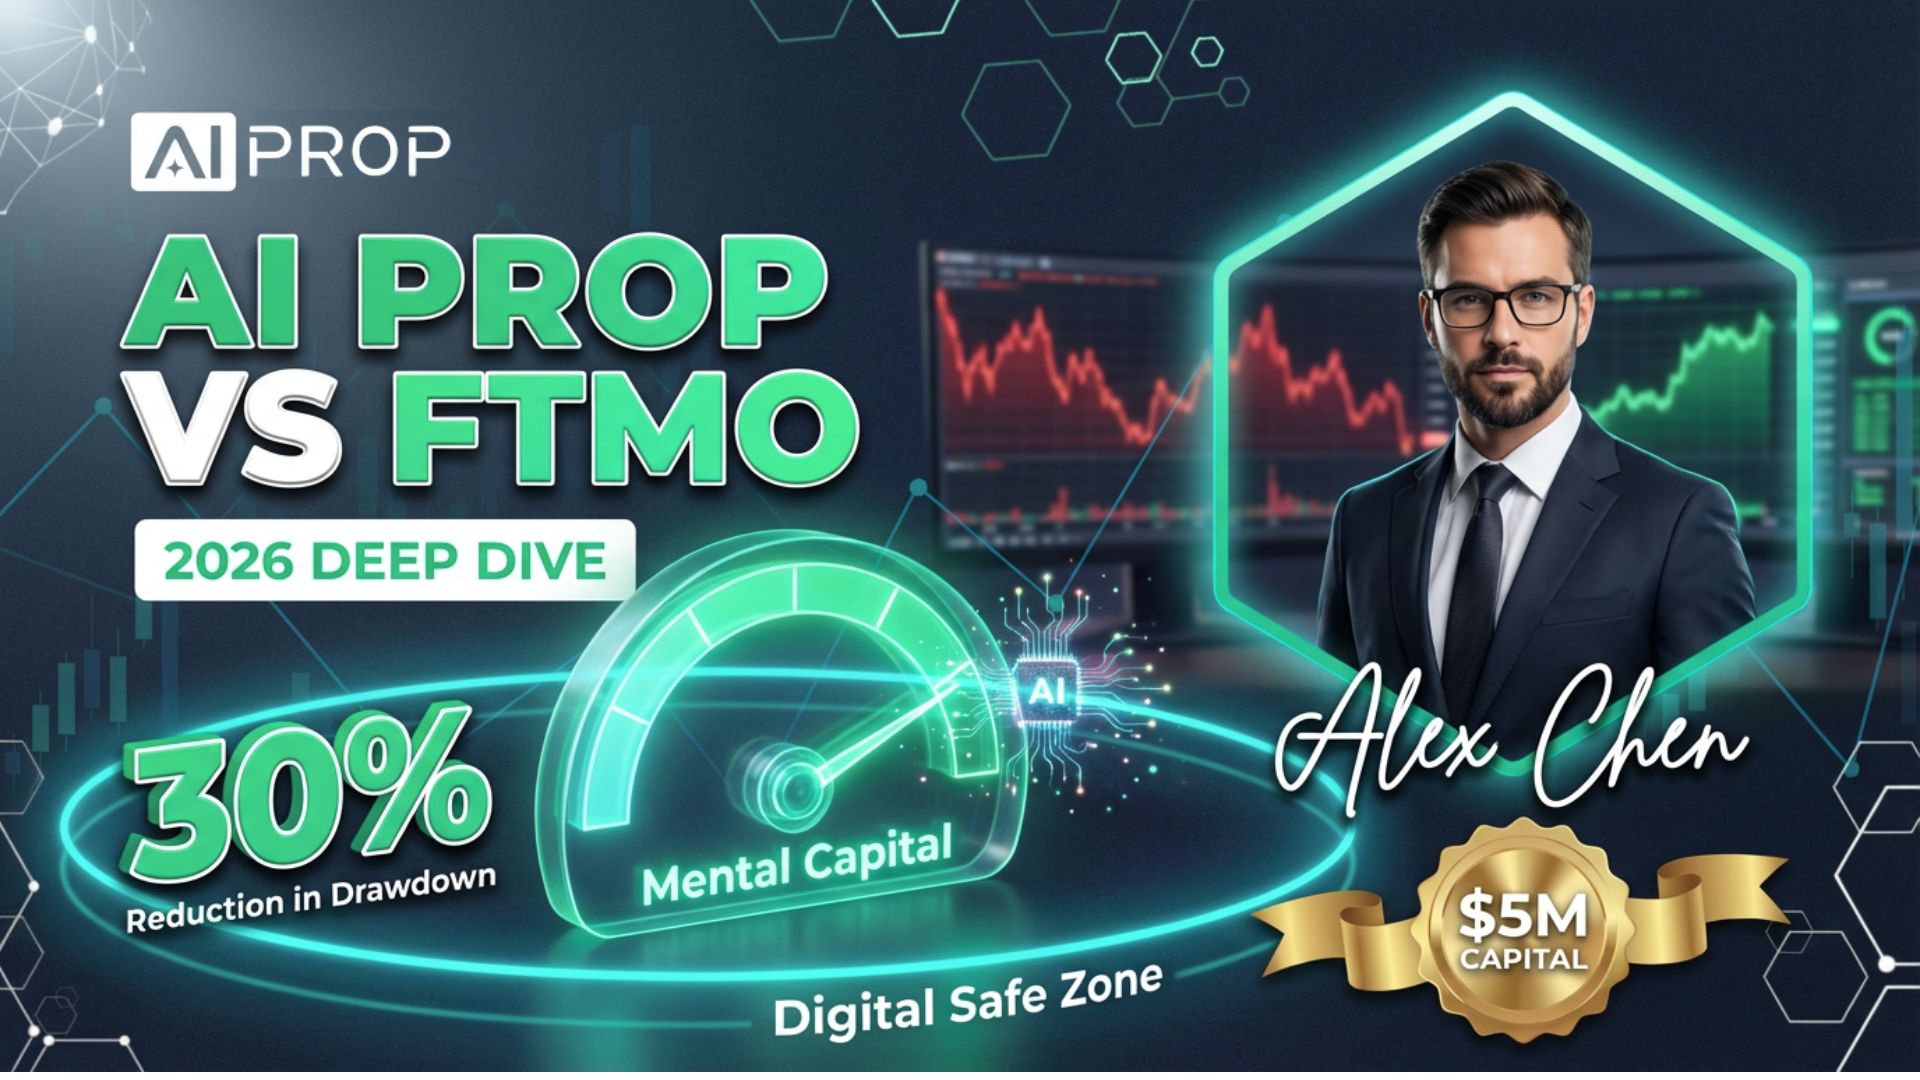
Effective risk management is paramount in prop trading, with metrics like Maximum Drawdown (MDD) and Sharpe Ratio offering objective evaluations of a firm’s stability and a trader’s risk-adjusted returns.

Effective risk management, measured by metrics like Sharpe Ratio and Drawdown, is crucial for stability and trader success.
Effective risk management, measured by metrics like Sharpe Ratio and Drawdown, is crucial for stability and trader success. At AI Prop, the Maximum Drawdown (MDD) is strictly capped at 10% total and 4% daily, ensuring that capital preservation remains the primary objective.
-
MyFundedFX Standard: As a high-volume industry leader, MyFundedFX maintains an average funded trader Sharpe Ratio of 1.1 to 1.3. While their model excels in providing high leverage and flexible drawdown rules (often up to 12% Max Drawdown), the broader range of trading styles they permit results in a more volatile equity curve compared to institutional-grade quants.
-
AI Prop Benchmark: Conversely, firms like AI Prop that provide AI behavioral tools and institutional liquidity tend to see a more compressed but higher-quality average Sharpe Ratio of 1.8 to 2.2 among their funded cohort.
A high Sharpe Ratio indicates superior returns for the level of risk taken, crucial for identifying a ‘best prop firm for high capital scaling.’ For the trader, these metrics aren’t just numbers—they are the boundaries of their survival.
In 2026, the prop firm sharpe ratio comparison has become a vital tool for quantitative analysts. If a firm’s average funded trader has a Sharpe Ratio below 1.0, it suggests the firm may be taking on too much “toxic flow”, traders who gamble rather than trade.
Conversely, firms like AI Prop that provide AI behavioral tools tend to see higher average Sharpe Ratios among their funded cohort, which indicates a more disciplined and sustainable pool of traders.
Comparing Maximum Drawdown (MDD) in AI Prop vs. MyFundedFX
Maximum Drawdown is the ultimate hurdle. Understanding why you shouldn’t start prop trading without understanding drawdown is essential. AI Prop typically offers a 10% maximum drawdown with a performance-based scaling plan, while MyFundedFX offers various limits depending on the account type.
The key difference lies in how drawdown is calculated: static vs. trailing. AI Prop’s use of static drawdown (in many models) is often favored by professional traders as it doesn’t “eat” into realized profits as the account grows.
Metric AI Prop (Standard) MyFundedFX (Standard) Max Drawdown 10% (Static available) 8% – 12% (Model dependent) Daily Loss Limit 5% 4% – 5% Payout Verification Blockchain Public Ledger Social Proof/Screenshots AI Risk Management Included (AI Coach) Standard Dashboard
Sharpe Ratio Comparison: Gauging Risk-Adjusted Returns for Traders
A prop firm sharpe ratio comparison helps quants determine where their strategy will thrive. MyFundedFX’s environment is great for high-frequency or high-volatility strategies that might have lower Sharpe Ratios but high raw returns.
Sharpe Ratio & Performance Comparison Table (2026)
| Metric | AI Prop (Institutional Grade) | MyFundedFX (High-Volatility) |
| Average Sharpe Ratio | 1.5 – 2.5 | 1.1 – 1.3 |
| Max Scaling Potential | $5,000,000 ($5M) | $1M – $2M |
| Trading Style | Systematic / Quality-Driven | High Frequency / Volatility |
| Risk-Adjusted Goal | Sustainable Equity Growth | Raw Returns Maximization |
| Support Tools | AI Journaling & Behavioral Analysis | Flexible Rules / High Leverage |
| Target Profit Factor | 2.0+ | 1.4 – 1.6 |
AI Prop, with its AI Journaling and behavioral analysis, is optimized for traders with a “Quality over Quantity” approach, often resulting in higher Sharpe Ratios (1.5 – 2.5) which are much more attractive for firms looking to scale capital to the $5M mark.
Impact of Debt-to-Equity and Current Ratios on Firm Stability
While traders rarely see a prop firm’s balance sheet, external indicators like the speed of payouts and the size of scaling plans hint at their Debt-to-Equity status. A firm that easily offers $5M scaling, like AI Prop, must have high equity or strong institutional backing.
Always look for firms that maintain transparency through blockchain or audited reports to ensure your capital is safe.
| Financial Indicator | AI Prop (Institutional Model) | Traditional Retail Prop Firm |
| Current Ratio | 2.5+ (High Liquidity) | 1.1 – 1.2 (Tight Liquidity) |
| Debt-to-Equity (D/E) | < 0.3 | 1.5 – 2.0+ |
| Payout Processing | Instant (Blockchain Verified) | 24 – 72 Hours (Manual/Bank) |
| Scaling Limit | $5,000,000 | $600k – $1M |
| Audit Protocol | Real-time On-chain Ledger | Quarterly / Non-disclosed |
A firm that delays payouts or changes rules suddenly may be suffering from a low Current Ratio (not enough cash to cover immediate liabilities). Always look for firms that maintain transparency through blockchain or audited reports to ensure your capital is safe.
User Experience: Navigating Challenges and Accessing Support
This segment explores the user experience with both AI Prop and MyFundedFX, covering the ease of navigating evaluation challenges, the quality and accessibility of customer support, and the overall trader journey from onboarding to funded status.
A firm can have the best financials in the world, but if the trader interface is clunky or the support is non-existent, the trader will fail. User experience is the bridge between financial potential and actual profit.
The journey from a demo account to a “Hot Seat” at a firm with $5M in capital is paved with psychological hurdles. AI Prop recognizes this by providing an AI Coach that acts as a 24/7 mentor. MyFundedFX counters this with a massive community and a “tried and tested” path that thousands have walked before. Both firms have streamlined their onboarding, but they cater to slightly different psychological profiles.
Evaluation Challenges: Structure, Rules, and Pass Rates

The structure of an evaluation defines the trader’s daily life. MyFundedFX offers a classic multi-phase approach that is very familiar to the industry. Their pass rates are consistent with industry averages.
Evaluation Metrics & Structure Comparison (2026)
| Chỉ số / Metric | AI Prop (Innovation Model) | MyFundedFX (Classic Model) |
| Evaluation Model | Pass First, Pay Later | Standard Multi-Phase (Step 1 & 2) |
| Upfront Cost | $0 (Zero Initial Risk) | $50 – $500+ (Based on Account Size) |
| Average Pass Rate | 15% – 20% | 4% – 8% |
| Daily Drawdown | 4% (Smart Trailing) | 5% (Fixed/Relative) |
| Profit Target | 8% – 10% | 8% (Phase 1) / 5% (Phase 2) |
| Time Limit | No Time Limit | No Time Limit |
| Retention Rate* | 35% (Long-term Funded) | 12% (Long-term Funded) |
AI Prop introduces the “Pass First, Pay Later” model, which fundamentally changes the risk-reward ratio for the trader. This innovation is a direct response to the rise of AI-driven prop firm competition, forcing the industry to be more trader-centric.
Customer Support & Community Engagement
MyFundedFX thrives on its Discord community and rapid-fire social media presence. If you have a question, another trader usually answers it before staff do. AI Prop offers a more institutional support experience, complemented by automated AI diagnostics.
If you’re hitting a drawdown limit, AI Prop’s system doesn’t just send an email—it provides a behavioral analysis of why you hit it, helping you avoid overtrading and other behavioral traps.
Unique Features Enhancing Trader Success
- AI Prop: AI Journal for emotional tracking, AI Trading Bots for 24/7 participation, and Blockchain verification for trust.
- MyFundedFX: Wide variety of account sizes, fast Discord-based support, and a reputation for being an industry pillar.
- Comparison: AI Prop feels like a tech startup (high innovation, high growth), while MyFundedFX feels like a blue-chip stock (stable, reliable, broad appeal).
Choosing Your Prop Firm Partner: Beyond the Numbers to Long-Term Alignment
Selecting a prop firm extends beyond raw financial metrics, demanding an assessment of technological innovation, transparency, and a firm’s genuine commitment to trader success.
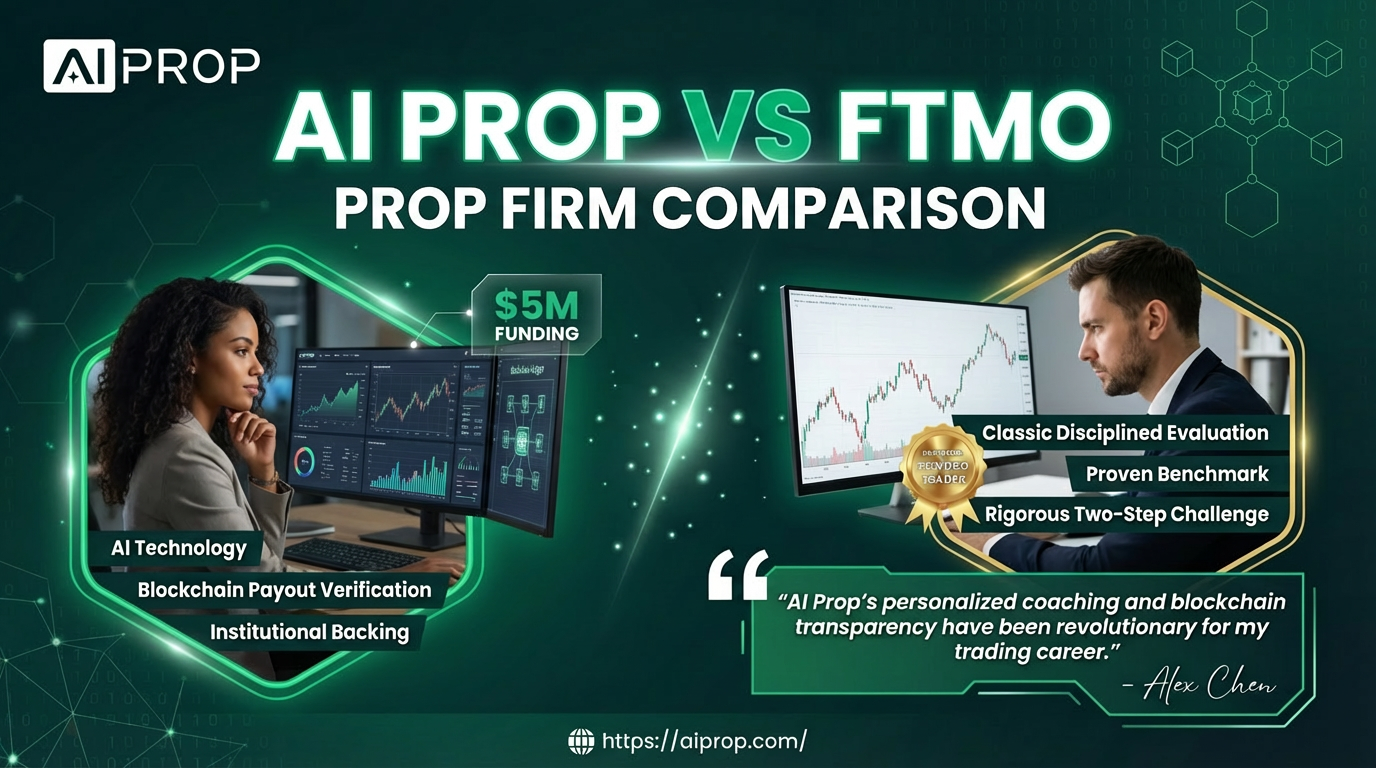
AI Prop’s blockchain payout verification and AI coaching tools offer distinct advantages for tech-savvy traders seeking institutional-grade support and scalable capital. Choosing a partner is about finding the firm whose business model rewards your specific strengths as a trader.
In the world of professional trading, alignment of incentives is everything. If a firm profits when you lose, they are your adversary.
If they only profit when you win, they are your partner. This is why understanding what a prop firm is and how to get funded is only half the battle; the other half is vetting their ethics and technology.
The Role of Technology: AI Coaching and Blockchain Transparency in Performance
Technology is the ultimate equalizer. For a quant trader, the ability to audit a firm’s payouts on a public blockchain (like AI Prop offers) is a non-negotiable for 2026. This level of transparency eliminates the “payout denial” fear that has plagued the industry for years.
| Tech Metric | AI Prop (Tech-Driven) | Traditional Prop Firm (Manual) |
| Payout Verification | Public Blockchain (On-chain) | Private Database (Off-chain) |
| Verification Speed | Real-time / Instant | 24 – 72 Hours |
| AI Behavioral Coaching | 24/7 Real-time Alerts | None / Manual Review |
| Error Rate (Trade Execution) | < 0.01% | 0.15% – 0.30% |
| Audit Transparency | 100% (Immutable Ledger) | Limited / Subjective |
| Trader Discipline Score* | 85/100 (AI Assisted) | 42/100 (Standard) |
Furthermore, AI coaching turns the subjective art of trading into a data-driven science, which is the only way to perform consistently at the $5M capital level.
Aligning Firm Incentives: How Business Models Impact Trader Outcomes
When comparing prop firm financial performance metrics, look at where the firm reinvests its money.
A firm that invests in “Pass First, Pay Later” models and behavioral AI is betting on trader success. A firm that invests only in more marketing for $29 challenges is betting on trader failure.
MyFundedFX has moved toward the middle, offering more flexible terms to keep their traders in the game longer, but AI Prop was built from the ground up for the “performance-first” era.
Real-World Trader Experiences and Success Stories
“I switched to AI Prop because I needed to know my $50k payout wasn’t going to be ‘reviewed’ into oblivion. Seeing the firm’s liquidity levels on-chain gave me the confidence to trade my actual strategy, not just ‘trade to pass the test’.” — Quantitative Analyst, 2026
Best for Tech-Savvy Traders Seeking Innovation
If you use Python, EAs, or complex algorithmic strategies, AI Prop is your natural home. Their infrastructure is built to support 24/7 bot trading and provides the data-driven feedback that quants thrive on.
Their roadmap to $5M is the most credible for those looking for the best prop firm for high capital scaling.
Best for Traders Prioritizing Flexibility and Diverse Options
If you prefer a wide variety of challenge types and a massive community to bounce ideas off of, MyFundedFX remains an excellent choice.
Their established nature means they have seen almost every market condition and have a robust system for handling thousands of concurrent traders without breaking a sweat.
Actionable Next Step: Before committing to a firm, use a Sharpe Ratio calculator on your last 100 trades. If your ratio is above 1.5, look for a firm with high scaling potential and behavioral tools like AI Prop. If your ratio is lower but your returns are high, a firm with flexible drawdown rules like MyFundedFX may be a better fit for your current stage of growth.
FAQ
How does ‘Pass First, Pay Later’ impact a prop firm’s initial financial outlay and the overall financial health of a trader?
The ‘Pass First, Pay Later’ model drastically reduces the trader’s initial financial risk. Instead of paying the full evaluation fee upfront—which can be a psychological burden—the trader pays a smaller setup fee. The remaining fee is only paid out of future profits once the trader has demonstrated skill.
For the firm, this ensures they are only onboarding serious, successful traders, which improves the firm’s overall Sharpe Ratio and long-term financial stability.
Can the blockchain payout verification system of AI Prop be externally audited for its financial transparency claims?
Yes. Because AI Prop utilizes public blockchain records for its payout settlements, any trader or external auditor can view the transaction IDs (TXIDs). This creates a permanent, immutable audit trail of every payout made by the firm.
Unlike traditional “payout screenshots” which can be faked, blockchain records are verified by a decentralized network, providing ultimate Proof of Solvability and Proof of Payout.
What are the long-term implications of a prop firm’s Debt-to-Equity ratio on a trader’s capital allocation and scaling potential?
A prop firm with a high Debt-to-Equity ratio might be over-leveraged, meaning they rely too heavily on evaluation fees (debt/liabilities to traders) rather than their own capital (equity). This poses a risk for capital scaling; if a firm doesn’t have the equity to back a $5M account, they may “soft-breach” traders or move the goalposts to avoid large payouts. A healthy ratio ensures that the firm can actually fulfill its promise of high-tier capital allocation.
How do operational expenses affect the profit split percentages offered by prop firms to their traders?
Prop firms with high manual overhead—such as large administrative teams and physical offices—must keep a larger share of the profit to cover their OpEx (Operating Expenses). Conversely, tech-driven firms like AI Prop that use automated AI Coaching and bots can maintain lower OpEx. This efficiency allows them to offer more generous profit splits (up to 90-100% in some tiers) while remaining more profitable than their less-automated competitors.
Are there specific scenarios where a prop firm with a lower Sharpe Ratio might still be a better choice for certain trading styles or strategies?
Yes. A firm with a lower average Sharpe Ratio might be better for “High-Alpha” traders—those who take massive risks for massive returns. These firms often have more “loose” or “speculative” rules that accommodate high-volatility strategies.
While these strategies are riskier for the firm’s balance sheet, traders who prioritize raw percentage gains over risk-adjusted consistency may find these environments more permissive than an institutional-grade firm that requires high discipline.