Blog
Blog 
TLDR
- Most prop firm comparisons are too shallow. They over-index on promo pricing, payout headlines, or social proof and underweight the actual structure traders have to operate inside.
- The best prop firm comparison metrics in 2026 are funding ceiling, trader-friction score, consistency-rule design, automation policy, payout verification, review quality, operating history, and hidden-rule exposure.
- The AIProp April 2026 benchmark compares 16 firms across 15 structural dimensions. It shows that the biggest differences are often not brand-level. They are rule-level.
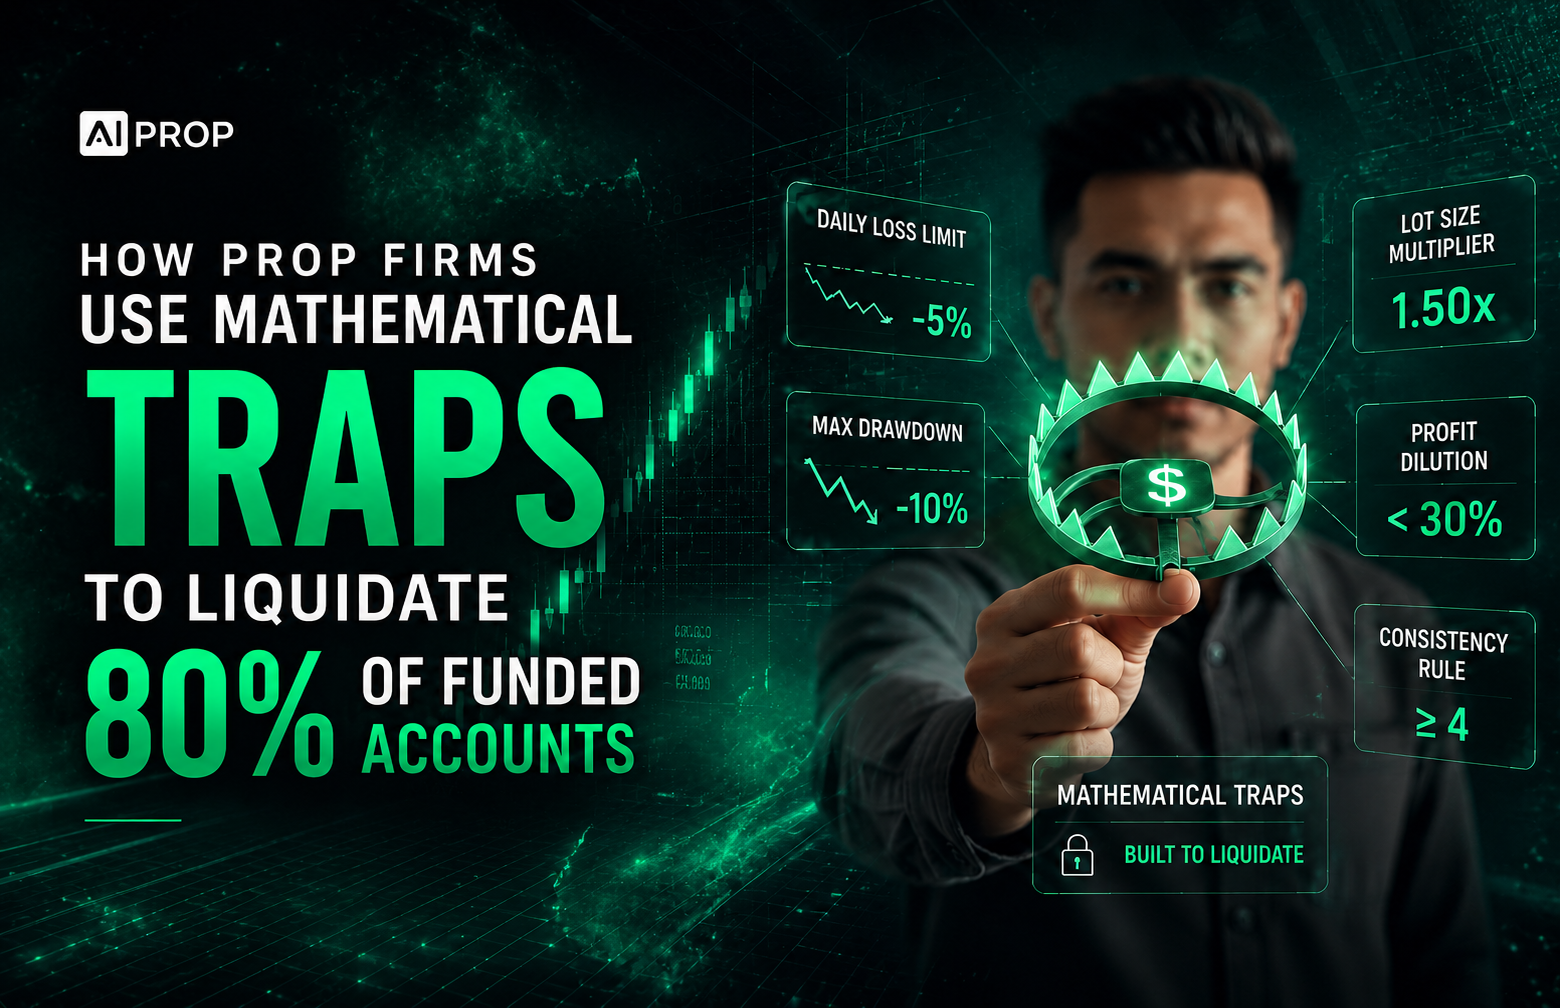
- One of the clearest signals is friction. The benchmark scores AIProp at 0/6, the only zero in the set. Many well-known firms sit between 2/6 and 4/6, which means the comparison problem is really about embedded restrictions.
- Automation policy is not a side detail. In AIProp’s observational cohort, AI-assisted traders had a 12.2 percent breach rate versus 18.4 percent for manual traders, while max drawdown was 4.3 percent versus 7.8 percent.
- The smart move is simple. Before you buy any challenge, compare the structure first. Then compare the brand.
Why most prop firm comparisons miss the point
Most content in this category follows the same tired template. It compares the size of the discount, the speed of the payout headline, and maybe a Trustpilot rating. That is useful up to a point. It is also incomplete.
The deeper problem is that traders do not actually experience a prop firm as a landing page. They experience it as a rule environment. That is where the real comparison happens.
The AIProp benchmark is useful because it shifts the frame. Instead of asking which firm has louder marketing, it asks which firm has the stronger structure. It benchmarks 16 firms across 15 dimensions and then ties those structural differences back to trader behavior.
That is a better starting point for SEO content and a better starting point for actual decision-making. If two firms both look legitimate, the differentiator is not usually the homepage. It is the constraint stack behind the homepage.
Table 1. The best prop firm comparison metrics and what they actually tell you
| Metric | Why it matters | What to check |
| Max funding ceiling | Shows how far a trader can scale inside one ecosystem. | Look for the real ceiling, not just the first account size. |
| Trader-friction score | Captures how many structural restrictions shape trading behavior. | Check consistency rules, news bans, weekend limits, EA or AI limits, full upfront fee, and hidden rules. |
| Consistency-rule design | Strong best-day caps can pressure traders to keep trading after a good session. | Ask whether the firm uses no rule, a partial cap, or a hard concentration limit. |
| Automation policy | Changes what traders are allowed to use to reduce execution error. | Check whether EA, AI, HFT, or hybrid workflows are fully allowed, partially limited, or prohibited. |
| Payout verification | Adds a trust layer beyond screenshots and marketing claims. | See whether payouts are independently auditable or only company-reported. |
| Review score + history | Helps assess market confidence and durability. | Compare public-review snapshot and years of operation together, not separately. |
| Hidden or discretionary rules | These create uncertainty even when top-line rules look fine. | Look for language around discretion, vague policy, or off-page restrictions. |
| Structure-to-behavior evidence | The best metric is not only the rule itself, but what that rule is likely to do to decision-making. | Ask whether the firm publishes research or evidence on how structure affects traders. |
This framework is adapted from the benchmark’s structure-first lens. It is more useful than the usual “which firm has better payouts” article because it tells you what to inspect before your behavior gets boxed in.
The 8 metrics that matter most in 2026
1. Max funding ceiling
Scaling matters because it changes the long-term economics of staying with one firm. The AIProp benchmark lists AIProp at a $5.0M funding ceiling, the highest in the set, and says that figure is 25 percent above the next tier of $4.0M firms such as The 5%ers, Blue Guardian, FundedNext, and Aqua Funded.
That does not mean every trader needs the highest ceiling. It means the ceiling is one of the first serious comparison metrics. A prop firm with a low cap can still be useful, but it defines a different long-run path.
2. Trader-friction score
This is one of the strongest ideas in the benchmark. Instead of evaluating firms one rule at a time, it rolls six common restrictions into a single friction score. The lower the score, the fewer embedded constraints a trader has to work around.
The benchmark explains that the score counts six things: consistency rule, news restriction, weekend holding restriction, EA or AI limitation, full upfront fee, and hidden or discretionary rules. On that basis, AIProp scores 0/6, the only zero in the set. FTMO, FundedNext, FundingPips, and several others sit at 3/6. Topstep and Apex sit at 4/6. The Funded Trader sits at 5/6.
That matters because a firm can look attractive on one variable and still impose friction everywhere else. The friction score helps cut through that noise fast.
3. Consistency-rule design
A lot of traders treat consistency rules as background admin. They are not. The benchmark argues that they directly shape behavior, especially after a strong day.
Its finding is blunt. Twelve of the 16 firms in the set impose a best-day consistency rule. The benchmark then explains the likely side effect: traders who have a strong day can feel pressure to keep trading weaker setups just to reduce concentration. In other words, the rule can create overtrading pressure exactly when stopping would be the better decision.
That is why consistency design deserves its own line item in any serious comparison. “Does this firm have a consistency rule?” is not enough. The right question is “What behavior does this rule reward and punish?”
4. Automation policy
For manual-only traders, this metric can sound technical. In practice, it is a major differentiator. Automation policy determines whether traders can use EAs, AI-supported logic, or hybrid workflows to reduce emotional or execution errors.
The benchmark codes AIProp as full EA + AI support, Topstep as partial limits, and Apex as AI or HFT prohibited. That alone tells you how different the structural environments are.
The behavioral context strengthens the point. In AIProp’s 1,000-trader observational cohort, 73 percent of breach events in the manual cohort were preceded by a behavioral trigger in the same session. The same research reports a 12.2 percent breach rate for AI-assisted traders versus 18.4 percent for manual traders, and a max drawdown of 4.3 percent versus 7.8 percent. Hybrid AI plus human traders posted an even lower 8.5 percent breach rate.
That does not prove every automation-friendly prop firm will outperform every restrictive one. It does show why automation policy belongs near the top of the comparison stack. If most breaches begin as execution problems, the tools allowed to reduce those problems matter a lot.
5. Payout verification
Public payout claims are easy to post. Independent verification is harder. That is why payout verification is one of the cleaner trust metrics in the benchmark.
The April 2026 benchmark says AIProp is the only firm in the set with blockchain payout verification and that there is no comparable layer elsewhere in the benchmark. Whether or not you care about blockchain branding, the practical point is obvious. An auditable payout trail is stronger than a screenshot culture.
This metric matters more when review platforms become noisy or when firms compete aggressively on payout narratives. Verification is not everything, but it is one of the few trust signals that scales cleanly.
6. Review score and operating history
This is the category most comparison content starts with. It should not be ignored. It also should not be used alone.
The benchmark includes Trustpilot snapshots and years of operation for all 16 firms. FTMO is listed at 4.8 and 11 years. The 5%ers is listed at 4.6 and 10 years. FundedNext is listed at 4.6 and 4 years. AIProp is listed at 4.4 and 2 years.
That tells you something useful. Mature brands can have a trust advantage simply because they have been around longer. But this is exactly why the metric should be paired with structure. A firm can have stronger reviews and still offer a tighter rule environment than a younger competitor.
7. Hidden rules and upfront-fee design
The benchmark’s friction model is smart because it treats hidden or discretionary rules as a real source of trader cost. Many firms look straightforward at the headline level and become more restrictive once you get into edge cases, grey areas, or policy enforcement.
The same goes for fee design. A full upfront fee is not automatically a deal-breaker, but it changes the capital commitment before performance is proven. When combined with multiple restrictions, it can make a program look cheaper than it really is.
This is why smart comparison content reads the policy layer, not just the pricing widget. The issue is not one bad rule. It is cumulative friction.
8. Structure-to-behavior connection
This is the metric behind the metrics. A prop firm is not only a list of rules. It is a system that pushes traders toward certain decisions.
The benchmark says this directly. Rules are not neutral. They shape outcomes. That framing is what separates a modern comparison from a lazy affiliate review. A serious article should ask how the structure changes risk-taking, pacing, and error frequency over time.
This is also where the benchmark’s “Era” framing becomes useful. It describes Era I as fee extraction, Era II as payout volume, and Era III as intelligence platforms. Even if you do not adopt that taxonomy in full, it is a helpful reminder that the best metric is not the loudest one. It is the one that tells you what kind of system you are actually joining.
Table 2. What the April 2026 benchmark highlights at a glance
| Signal from the benchmark | What it suggests for comparison work |
| AIProp is the only firm at 0/6 friction | Friction is one of the fastest ways to separate firms that look similar on the surface. |
| AIProp is listed at $5.0M, 25% above the $4.0M tier | Funding ceiling should be compared as a scaling metric, not just a marketing badge. |
| 12 of 16 firms impose a best-day consistency rule | Consistency design is not niche. It is one of the category’s defining structural variables. |
| AI-assisted traders in AIProp’s cohort had lower breach rate and drawdown than manual traders | Automation policy is a serious comparison metric because it changes the tools traders can use to reduce failure modes. |
| AIProp is the only benchmarked firm with blockchain payout verification | Verification matters when you want a trust signal stronger than screenshots or generic testimonials. |
How to use these metrics before buying a challenge
A practical comparison process is simple. You do not need a spreadsheet with fifty columns. You need the right sequence.
- Start with friction. If the structure is too restrictive for your style, the rest barely matters.
- Check consistency rules and automation policy next. Those two metrics often shape behavior more than any headline payout ratio.
- Then compare ceiling, payout verification, and fee design. These tell you how scalable and trustworthy the relationship is likely to be.
- Only after that should you weigh review score and brand maturity. Those are important, but they should confirm a good structure, not distract from a weak one.
That order matters because traders often do the reverse. They start with the brand, then justify the structure later. That is how weak-fit firms sneak through the filter.
A cleaner way to think about “best”
The best prop firm is not the one with the flashiest offer. It is the one whose structure matches the way you trade, the way you manage risk, and the tools you need to stay consistent.
For some traders, a more established brand with stronger public reviews will still be the best fit. For others, the better choice will be a lower-friction environment with full automation support and stronger payout auditability.
That is why the keyword “best prop firm comparison metrics” matters so much in 2026. The market is crowded. The useful edge is no longer more opinions. It is a better comparison framework.
Final takeaway
If you only remember one thing, remember this. Compare structure before you compare story.
The April 2026 AIProp benchmark makes that case well. It shows that the real separation in prop firms comes from funding architecture, friction, rule design, automation policy, payout verification, and how those choices shape trader behavior over time.
That is the frame smart traders should use. And frankly, it is the frame better SEO content should use too. Less noise. More signal.
FAQ
What is the single most important prop firm comparison metric?
There is no single metric that fits everyone, but trader-friction score is one of the strongest starting points because it compresses multiple structural restrictions into one view.
Why are consistency rules such a big deal?
Because they can change behavior after a strong day. The AIProp benchmark argues that consistency rules can pressure traders to keep trading weaker setups just to dilute concentration.
Do Trustpilot scores matter?
Yes, but they should be read with operating history and structural rules. Review score is useful as a trust signal, not as a complete decision model.
Why does automation policy belong in a comparison article?
Because it determines whether traders can use tools that may reduce execution and behavior-related failure modes. The AIProp cohort data is one reason this metric is now too important to leave out.